

The AutoTrader Price Index offers a monthly view of the Canadian automotive market by analyzing vehicle pricing associated with hundreds of thousands of new and used vehicle listings, bringing you the latest in pricing shifts and trends over time.
After a strong start to the year, there has been a gradual decrease in the demand for used cars since the beginning of Q3. This trend, combined with the surge in used inventory due to the strong growth in new car sales throughout 2023, has resulted in six consecutive months of declining prices for used cars. Additionally, new car prices have seen a modest decline in the last quarter, possibly indicating a near-term peak
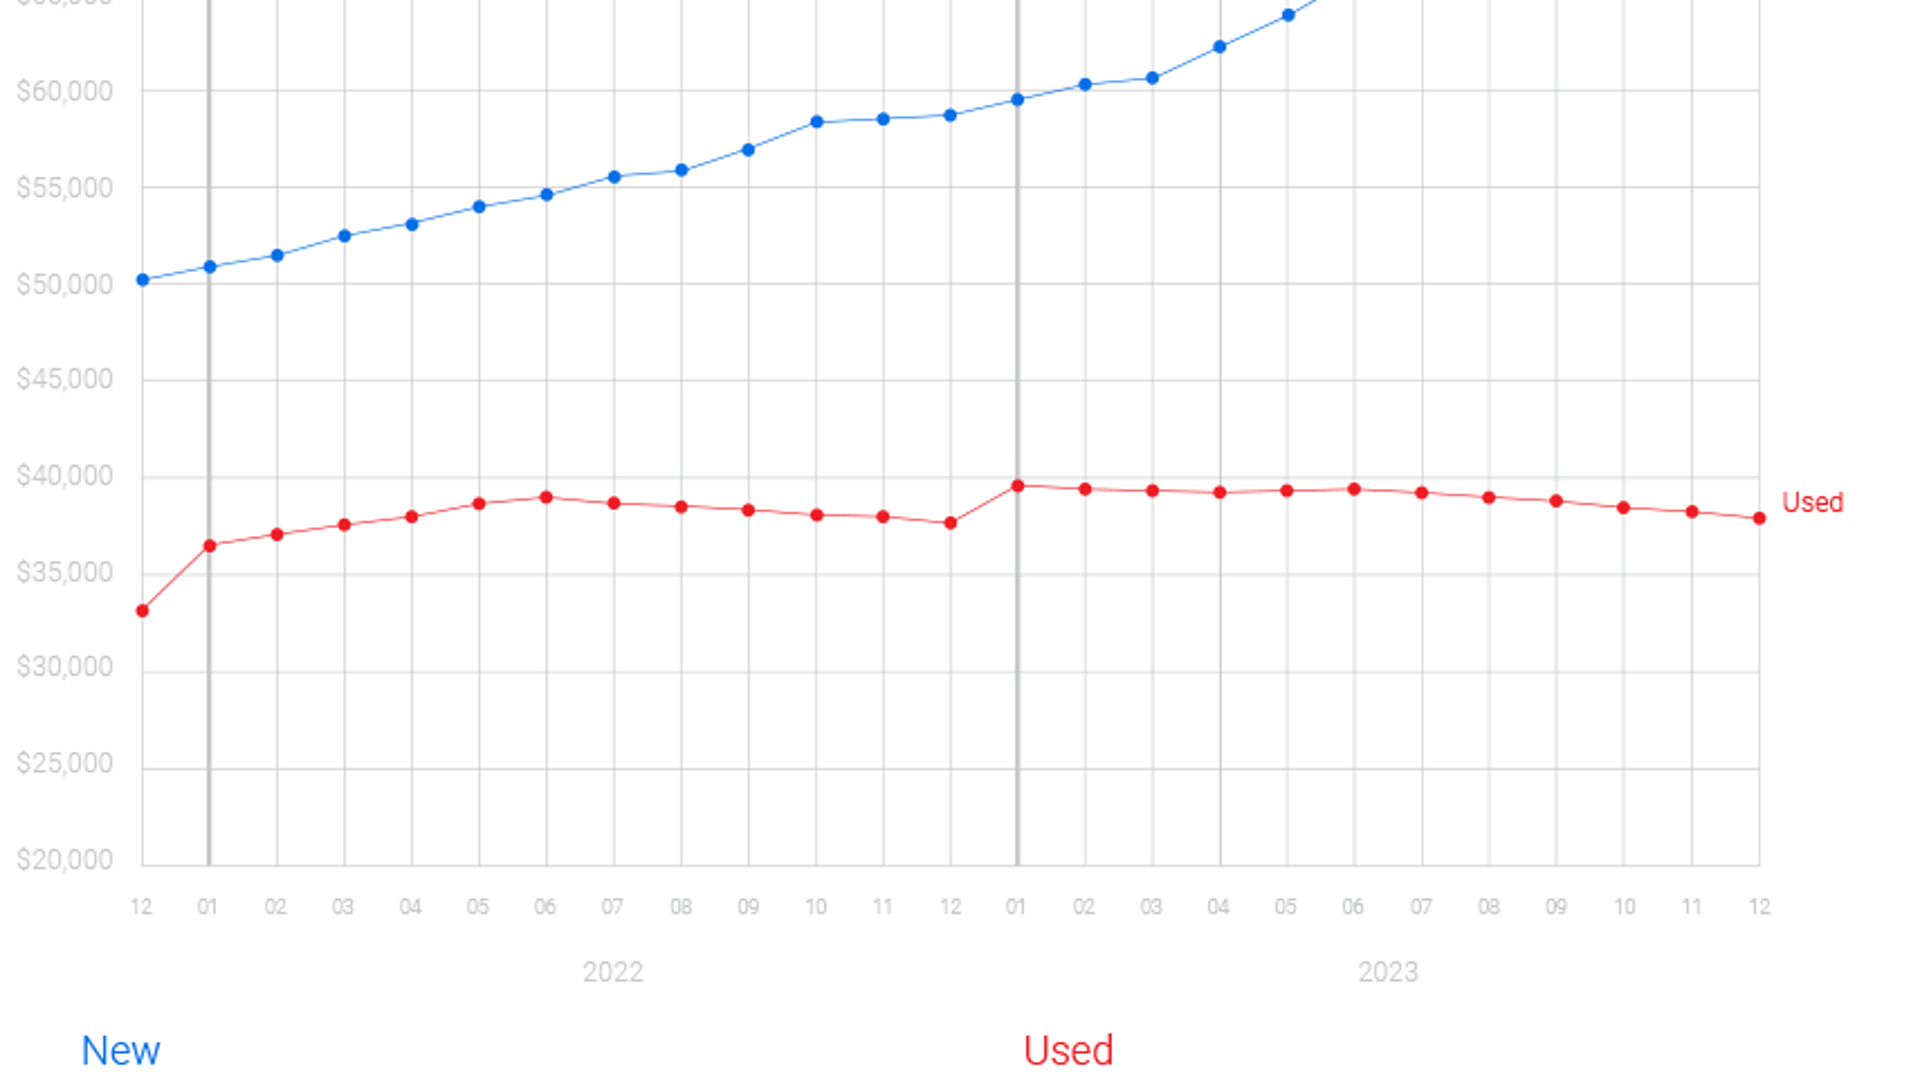
In December 2023, the average price of a used vehicle decreased by 2.4% compared to November, reaching $36,863, representing a 1.7% year-over-year increase. New vehicle prices stood at $67,259, reflecting a substantial 14.2% increase compared to the same period last year, though experiencing a slight 0.3% decrease on a month-over-month basis.
Looking ahead to January, with the continued rise in inventory levels and a slight dip in demand, it is anticipated that used car prices will be lower than those of the previous year for the first time in over 3.5 years.
- Summary
- Marketplace Index
- Average Monthly Payments (Used)
- Average Price by Body Type
- Average Price by Origin
- Average Price by Region (New)
- Average Price by Region (Used)
- Top Searched Vehicles
- Vehicle Inventory by Quarter (New)
- Vehicle Inventory by Quarter (Used)
Summary
The increase in interest rates appears to be achieving its intended effect, as we are witnessing a slight decline in used car demand compared to the performance of the first two quarters, but the used vehicle market is still healthy with steady demand.
The new car market, on the other hand, is still trying to catch up with pent-up demand. As mentioned in previous reports, we estimate that 1.3 million fewer new cars were sold between 2020–2022 during the peak microchip shortage and supply chain disruption period. Having said that, given the increase in new car inventory, we’ve started to see a slight decline in new car prices as well, which may be indicating that the prices have peaked for this segment – at least for the short term, as inflation will eventually play its role and push prices up mid- to long-term.
The good news for Canadian consumers is that both new and used car inventory levels are trending up, resulting in softened pricing for both used and new vehicles. There are a lot of great deals to be had in the market.
Looking at our proprietary Vehicle Affordability Index** to understand affordability by taking average weekly wages into account, both used and new car affordability have decreased slightly. As of October 2023 (the latest available data from StatsCan at the time of writing), it would take 32 and 55 weeks to purchase a used and new vehicle, respectively. Although these figures are still substantially higher than pre-COVID levels, it’s encouraging to see that affordability has started to improve both for new and used vehicles, which is good news for consumers.
Although inventory levels are still below pre-COVID levels, both new and used inventory has been trending upwards, experiencing a growth of approximately 67.6% and 6.3%, respectively, on a year-over-year basis.
** AutoTrader Analytics with StatsCan base data: Data Table 14–10–0222–01 Employment, average hourly and weekly earnings (including overtime), and average weekly hours for the industrial aggregate excluding unclassified businesses, monthly, seasonally adjusted.
Marketplace Index: National Average Prices
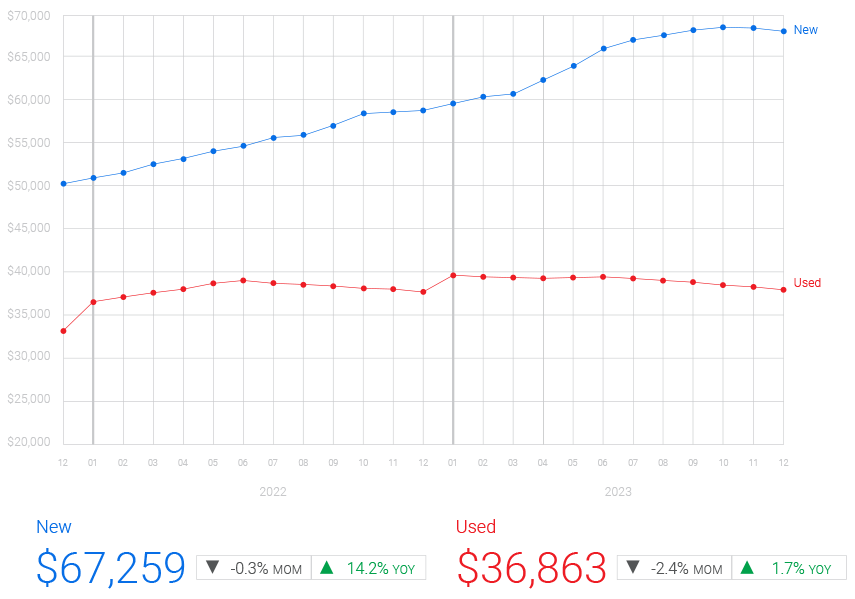
| Market | Average Price | MOM Change | YOY Change |
|---|---|---|---|
| New | $67,259 | -0.3% | 14.2% |
| Used | $36,863 | -2.4% | 1.7% |
New and used car prices are both softening
New car prices started to soften slightly with more availability in the market. Used vehicle prices experienced another month-over-month decline, for the sixth consecutive month, driven by the increase in inventory levels and a slight dip in demand. We expect to see the seasonal month-over-month price increase in January, but with more cars in the market, some normalization in pricing trends in the new year is expected, i.e., higher in the beginning of the year with monthly declines throughout the year (at around -7% on average). Moreover, we are also expecting to see used car prices below last year’s levels for the first time in over 3 years, starting in January.
Methodology
Based on average Canadian automotive pricing data (CAD $) collected from hundreds of thousands of listings monthly on AutoTrader from December 1, 2021 to December 31, 2023. In addition to average pricing, year-over-year (YOY) and month-over-month (MOM) price changes have been identified. The average has been adjusted based on the make and age of the vehicles available on the market during the collection period. The adjustments mean that any fluctuations in inventory won’t pull the average too far in one direction or another. Any changes under 0.1% have been denoted as 0.0%.
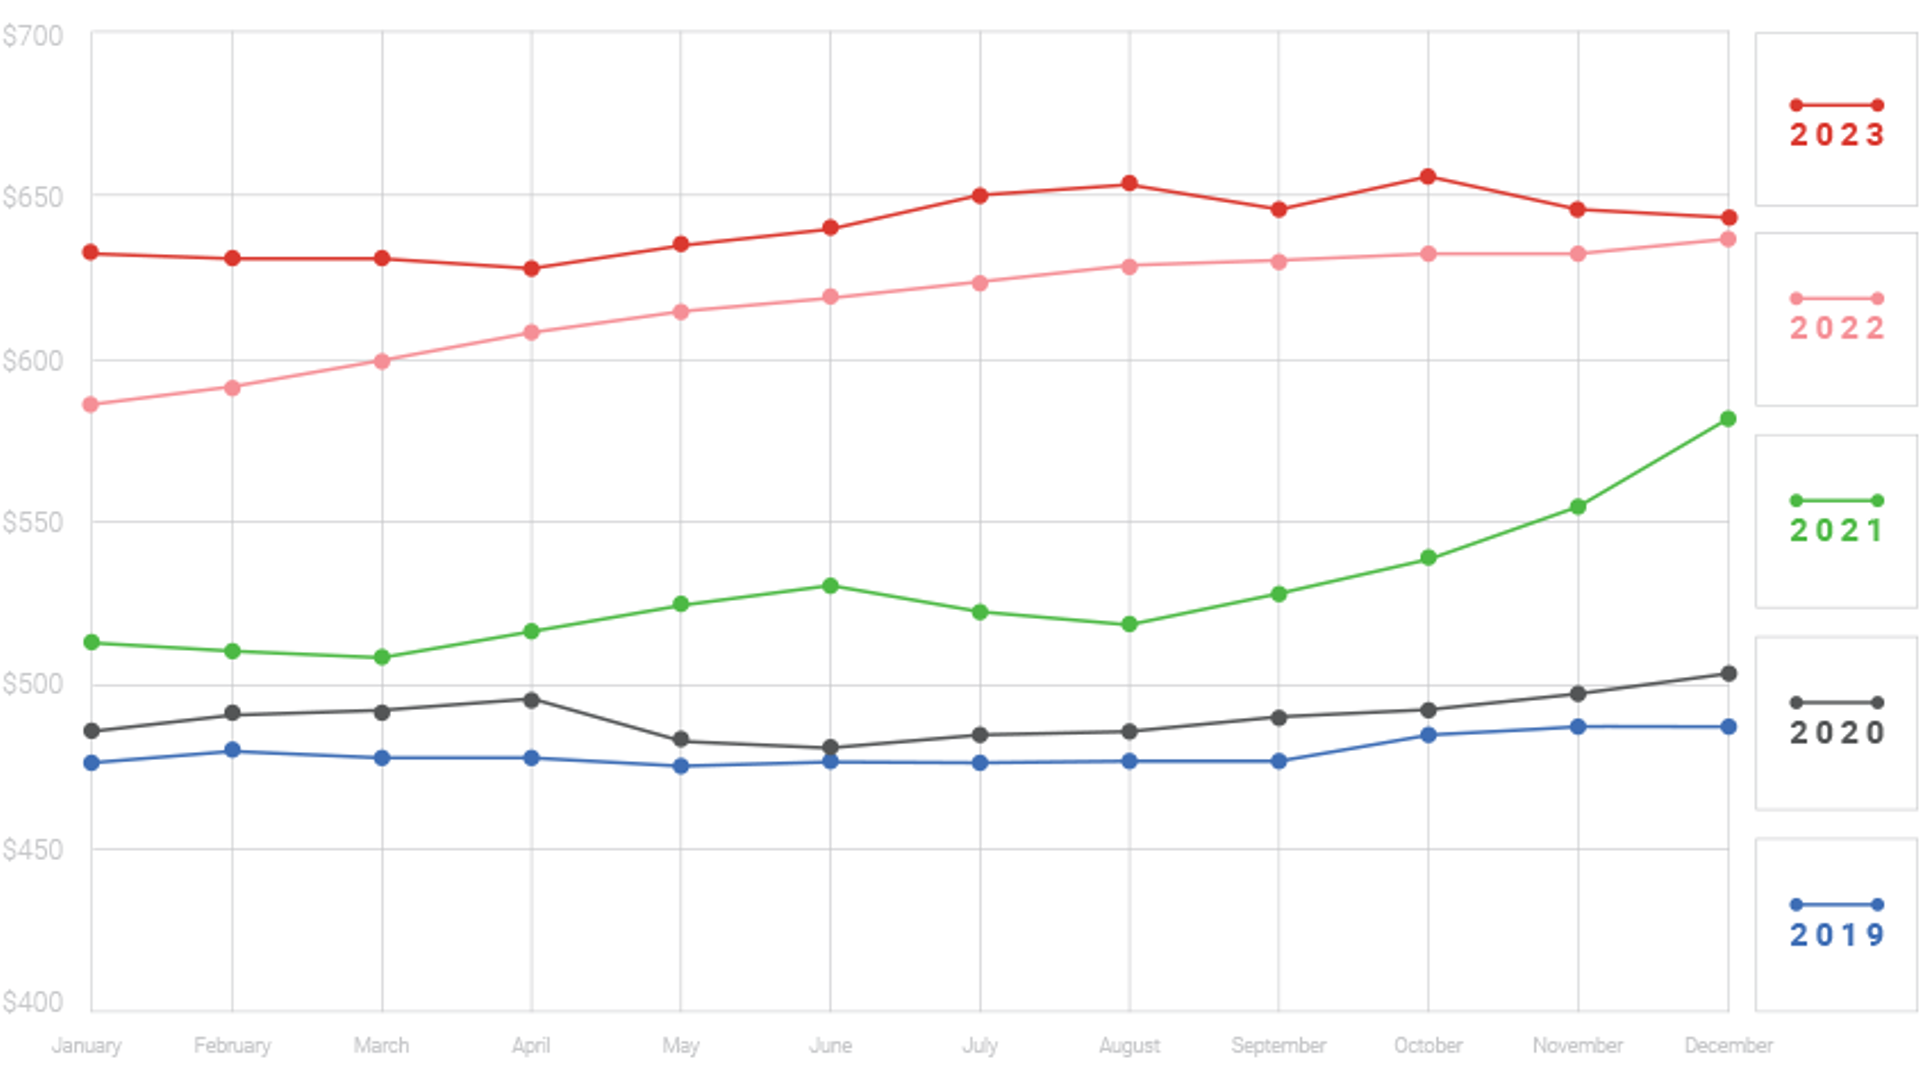
Average Monthly Payments (Used)

Aligned with the decline in prices, monthly payments for used vehicles have also started to decrease slightly but remain substantially higher than pre-pandemic levels
In contrast to the levels observed before the onset of the pandemic, the average monthly payment for used cars*** has surged by 37.2% in December. The average monthly payment of $647 remains, however, gradually decreasing. With the expectation of some interest rate cuts throughout the year, it’s expected that monthly payments will drop accordingly.
*** Dealertrack Canada, a TRADER Corporation, December 2023
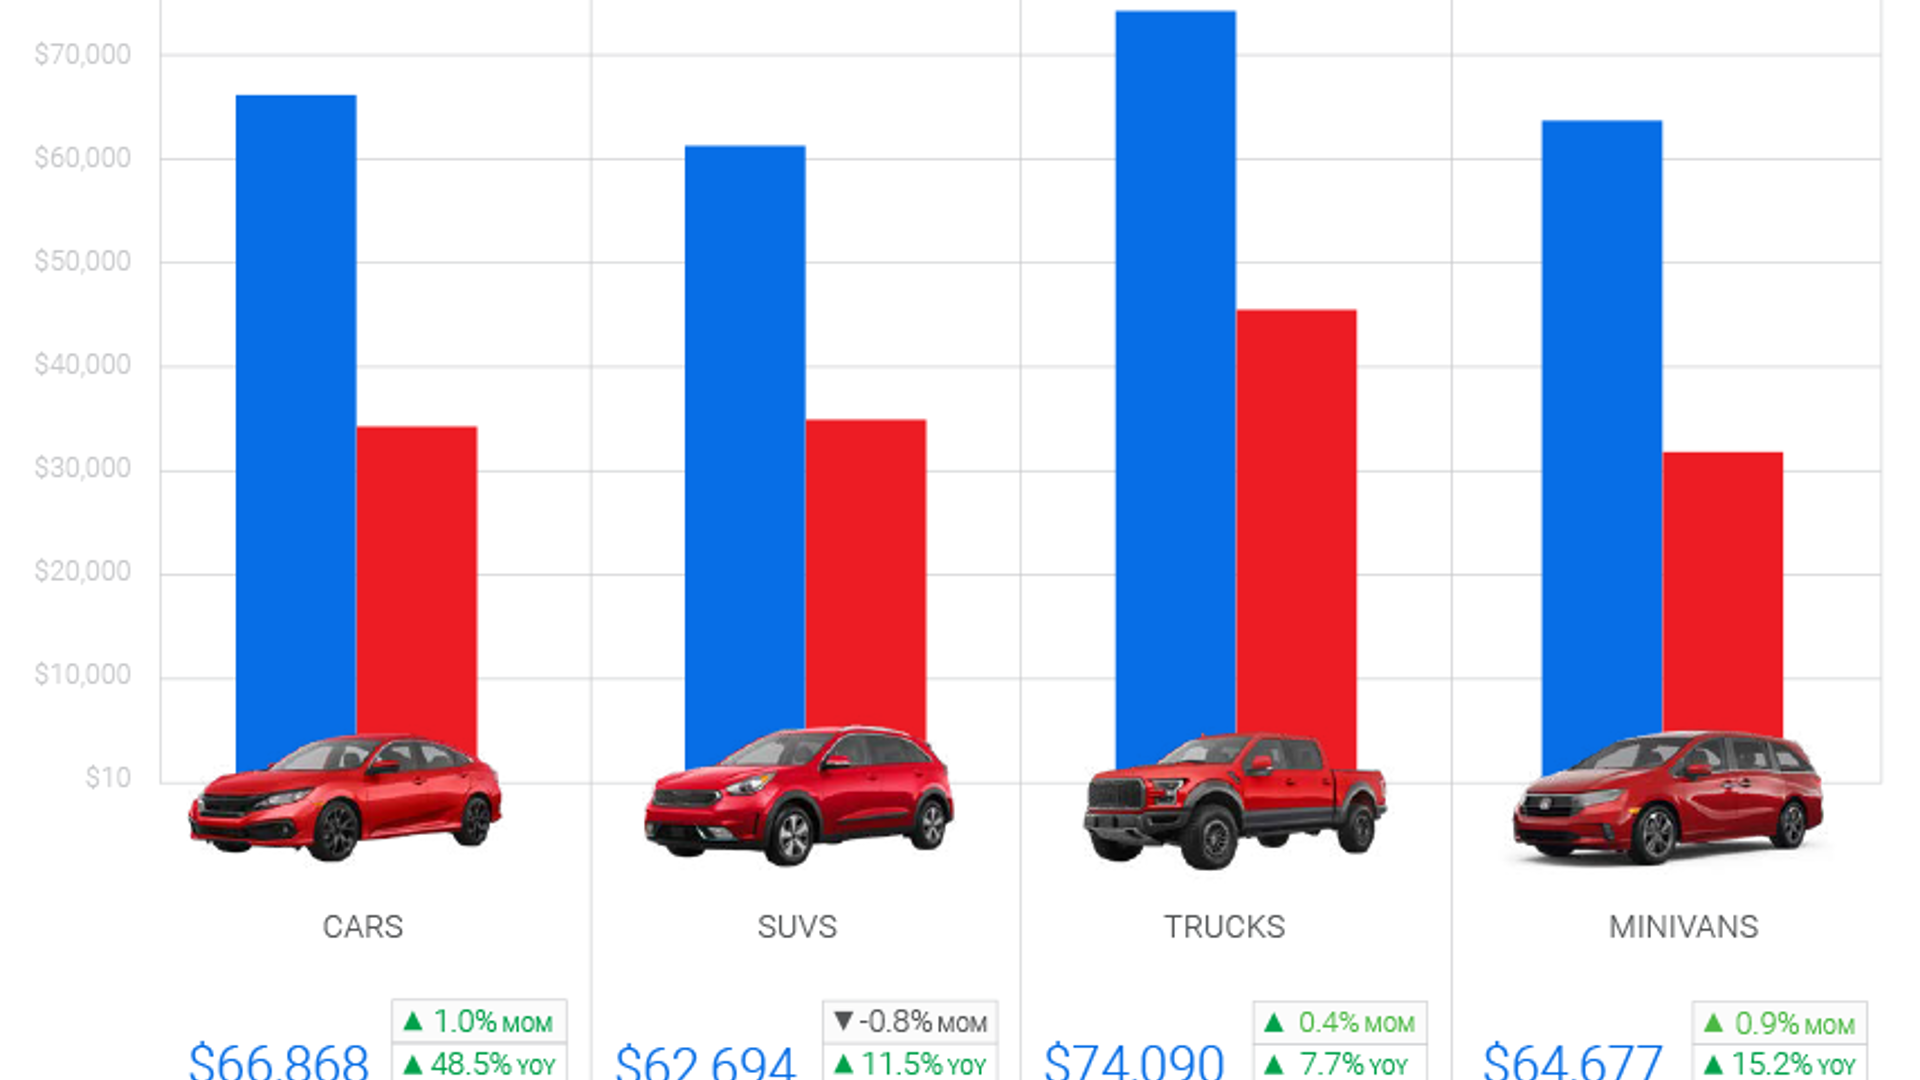
Average Price By Body Type: National
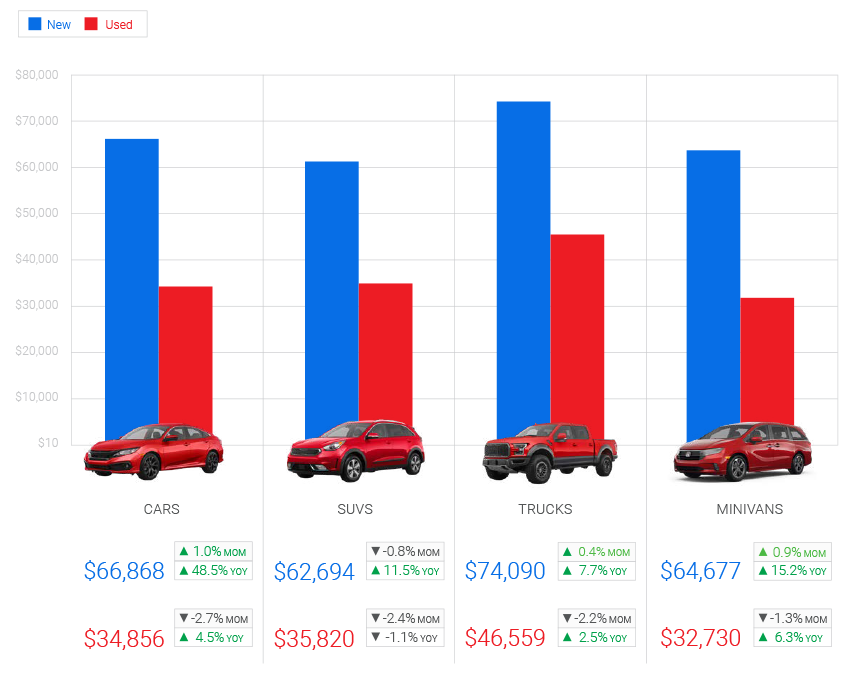
| Segment | Market | Average Price | MOM Change | YOY Change |
|---|---|---|---|---|
| Cars | New | $66,868 | 1.0% | 48.5% |
| Used | $34,856 | -2.7% | 4.5% | |
| SUVs | New | $62,694 | -0.8% | 11.5% |
| Used | $35.820 | -2.4% | -1.1% | |
| Trucks | New | $74,090 | 0.4% | 7.7% |
| Used | $46,559 | -2.25% | 2.5% | |
| Minivans | New | $64,677 | 0.9% | 15.2% |
| Used | $32,730 | -1.3% | 6.3% |
Used cars (with the exception of trucks, SUVs, and minivans) prices remain substantially high
Similar to our observations in the last report, the largest year-over-year price increases by body type can be seen in cars, specifically for new vehicles. We believe there are 3 main drivers behind this:
- The current macro environment is pushing some consumers to consider more affordable/ fuel-efficient vehicle.
- Automobile manufacturers are producing fewer new compact cars due to the trend toward larger vehicles over the past decade.
- There are more electric vehicles (EVs) in the compact car segment, which tend to be more expensive than their internal combustion engine (ICE) counterparts. Our analysis suggests that the price difference between ICE and EVs for like-for-like models is around 20%, with EVs being on the more expensive side.
Methodology
Based on average Canadian automotive pricing data (CAD $) collected from hundreds of thousands of listings monthly on AutoTrader from December 1, 2021 to December 31, 2023. In addition to average pricing, year-over-year (YOY) and month-over-month (MOM) price changes have been identified. The average has been adjusted based on the make and age of the vehicles available on the market during the collection period. The adjustments mean that any fluctuations in inventory won’t pull the average too far in one direction or another. Any changes under 0.1% have been denoted as 0.0%.
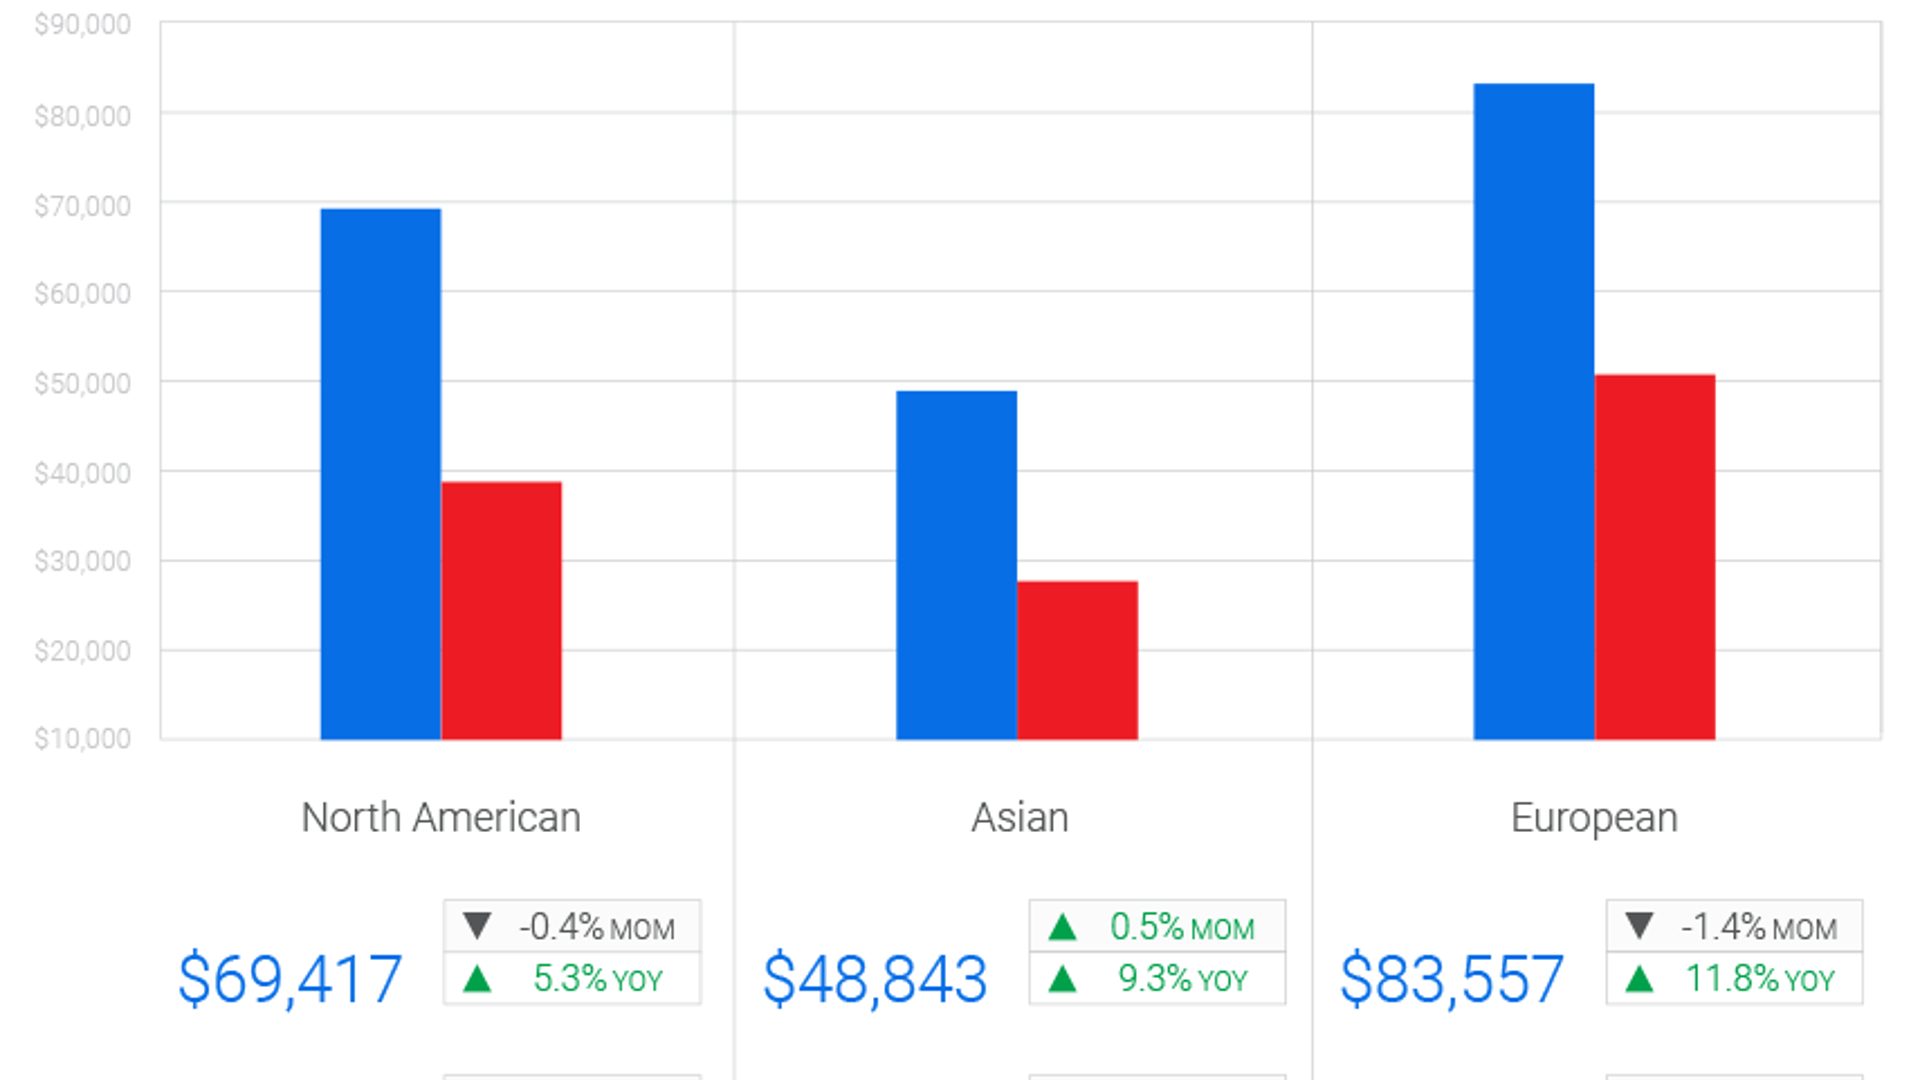
Average Price By Origin of Manufacturer

| Origin | Market | Average Price | MOM Change | YOY Change |
|---|---|---|---|---|
| North American | New | $69,417 | -0.4% | 5.3% |
| Used | $38,513 | -2.5% | 2.7% | |
| Asian | New | $48,846 | 0.5% | 9.3% |
| Used | $27,796 | -2.3% | -0.6% | |
| European | New | $83,557 | -1.4% | 11.8% |
| Used | $51,579 | -2.3% | 0.2% |
Modest increase in new Asian vehicle prices
Given the ongoing tightness in new Asian vehicle supply, these brands were the only segment that experienced a month-over-month increase in average prices.
All types of used vehicles (domestic, European, and Asian brands) observed month-over-month declines in the past few months.
Methodology
Based on average Canadian automotive pricing data (CAD $) collected from hundreds of thousands of listings monthly on AutoTrader from December 1, 2021 to December 31, 2023. In addition to average pricing, year-over-year (YOY) and month-over-month (MOM) price changes have been identified. The average has been adjusted based on the make and age of the vehicles available on the market during the collection period. The adjustments mean that any fluctuations in inventory won’t pull the average too far in one direction or another. Any changes under 0.1% have been denoted as 0.0%.
Average Price (New): By Region

| Region | December 2022 | December 2023 | YOY Change |
|---|---|---|---|
| British Columbia | $60,858 | $69,605 | 14.4% |
| Alberta | $63,231 | $69,647 | 10.1% |
| Saskatchewan & Manitoba | $60,941 | $65,968 | 8.2% |
| Ontario | $57,235 | $66,577 | 16.3% |
| Quebec | $55,660 | $66,228 | 19% |
| Atlantic Region | $53,900 | $62,186 | 15.4% |
Methodology
Based on average Canadian automotive pricing data (CAD $) collected from hundreds of thousands of used vehicle listings monthly on AutoTrader in December 2022 and December 2023. The Atlantic region is defined as: Nova Scotia, New Brunswick, Prince Edward Island and Newfoundland & Labrador. Due to limited population size, the territories are excluded, and Manitoba and Saskatchewan have been combined. The average has been adjusted based on the make and age of the vehicles available on the market during the collection period. The adjustments mean that any fluctuations in inventory won’t pull the average too far in one direction or another. Any changes under 0.1% have been denoted as 0.0%.
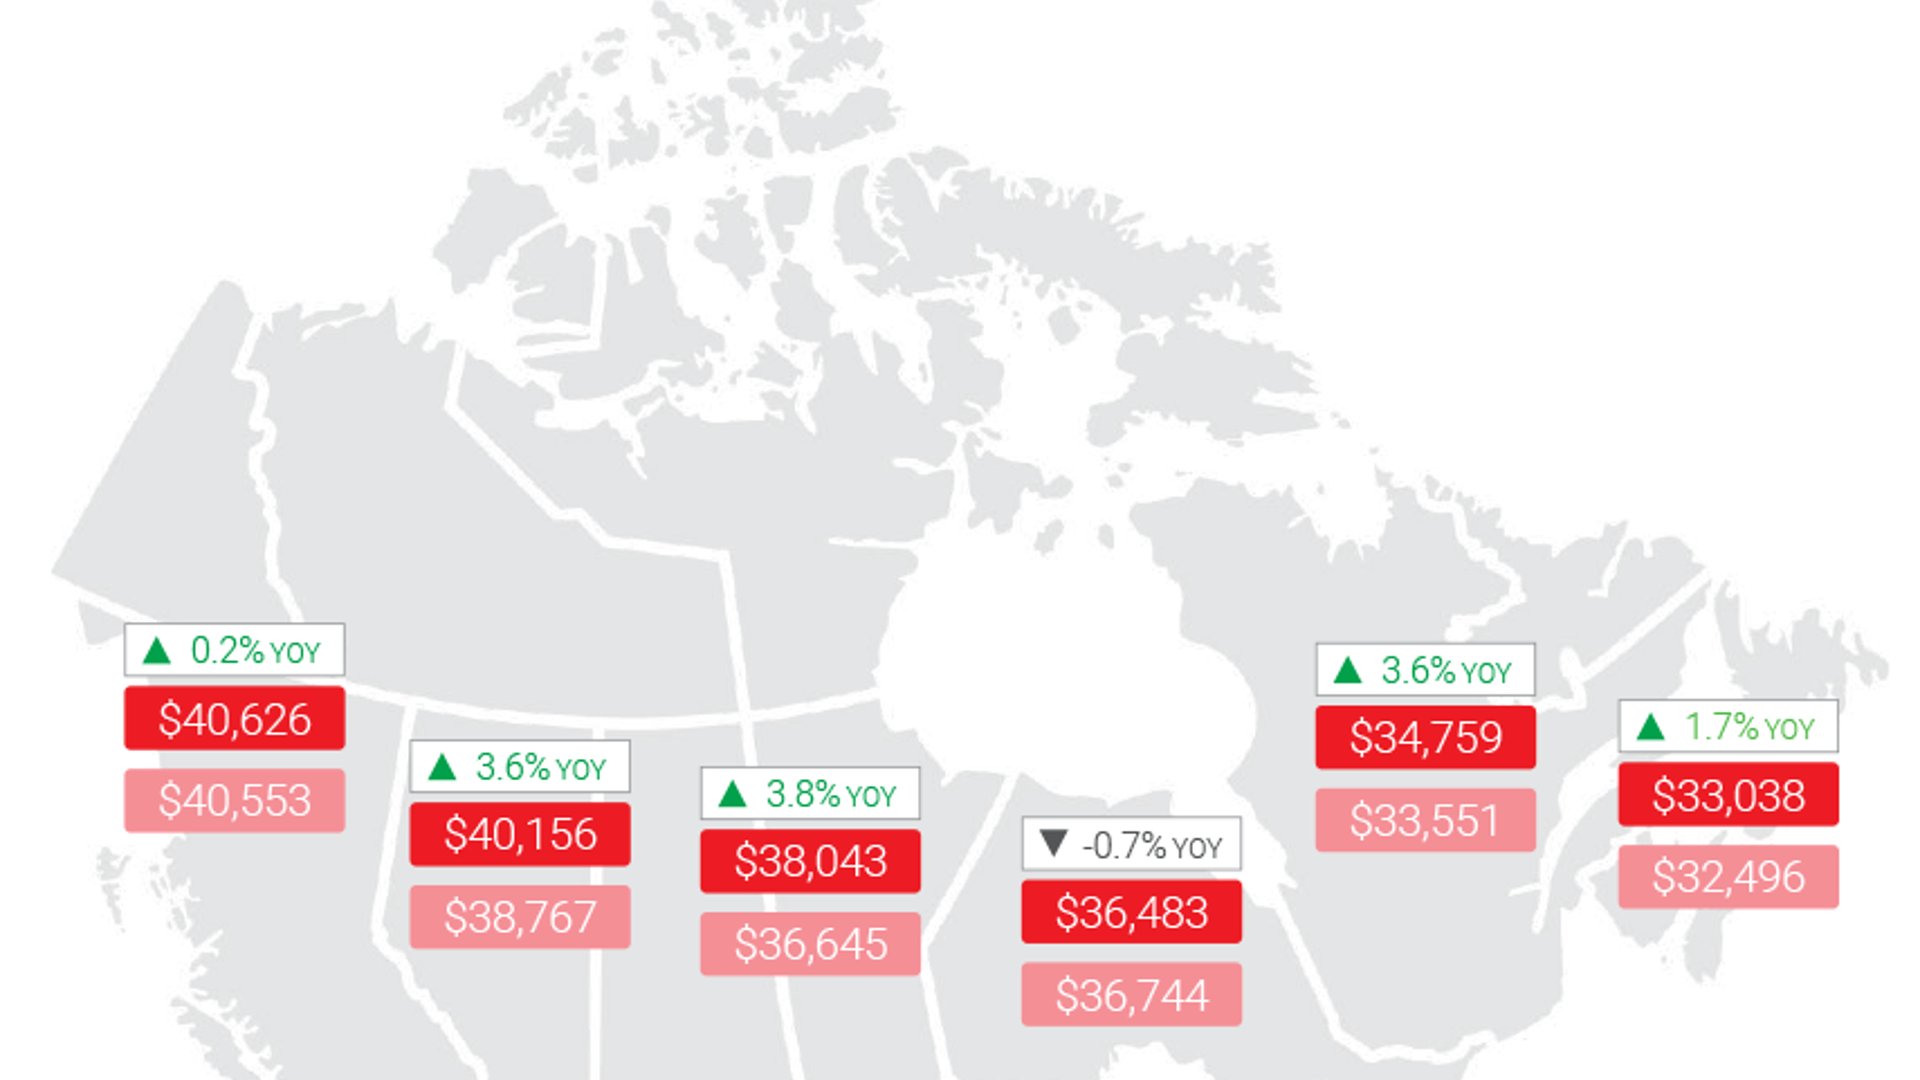
Average Price (Used): By Region

| Region | December 2022 | December 2023 | YOY Change |
|---|---|---|---|
| British Columbia | $40,553 | $40,626 | 0.2% |
| Alberta | $38,767 | $40,156 | 3.6% |
| Saskatchewan & Manitoba | $36,645 | $38,043 | 3.8% |
| Ontario | $36,744 | $36,483 | -0.7% |
| Quebec | $33,551 | $34,759 | 3.6% |
| Atlantic Region | $32,496 | $33,038 | 1.7% |
Methodology
Based on average Canadian automotive pricing data (CAD $) collected from hundreds of thousands of used vehicle listings monthly on AutoTrader in December 2022 and December 2023. The Atlantic region is defined as: Nova Scotia, New Brunswick, Prince Edward Island and Newfoundland & Labrador. Due to limited population size, the territories are excluded, and Manitoba and Saskatchewan have been combined. The average has been adjusted based on the make and age of the vehicles available on the market during the collection period. The adjustments mean that any fluctuations in inventory won’t pull the average too far in one direction or another. Any changes under 0.1% have been denoted as 0.0%.
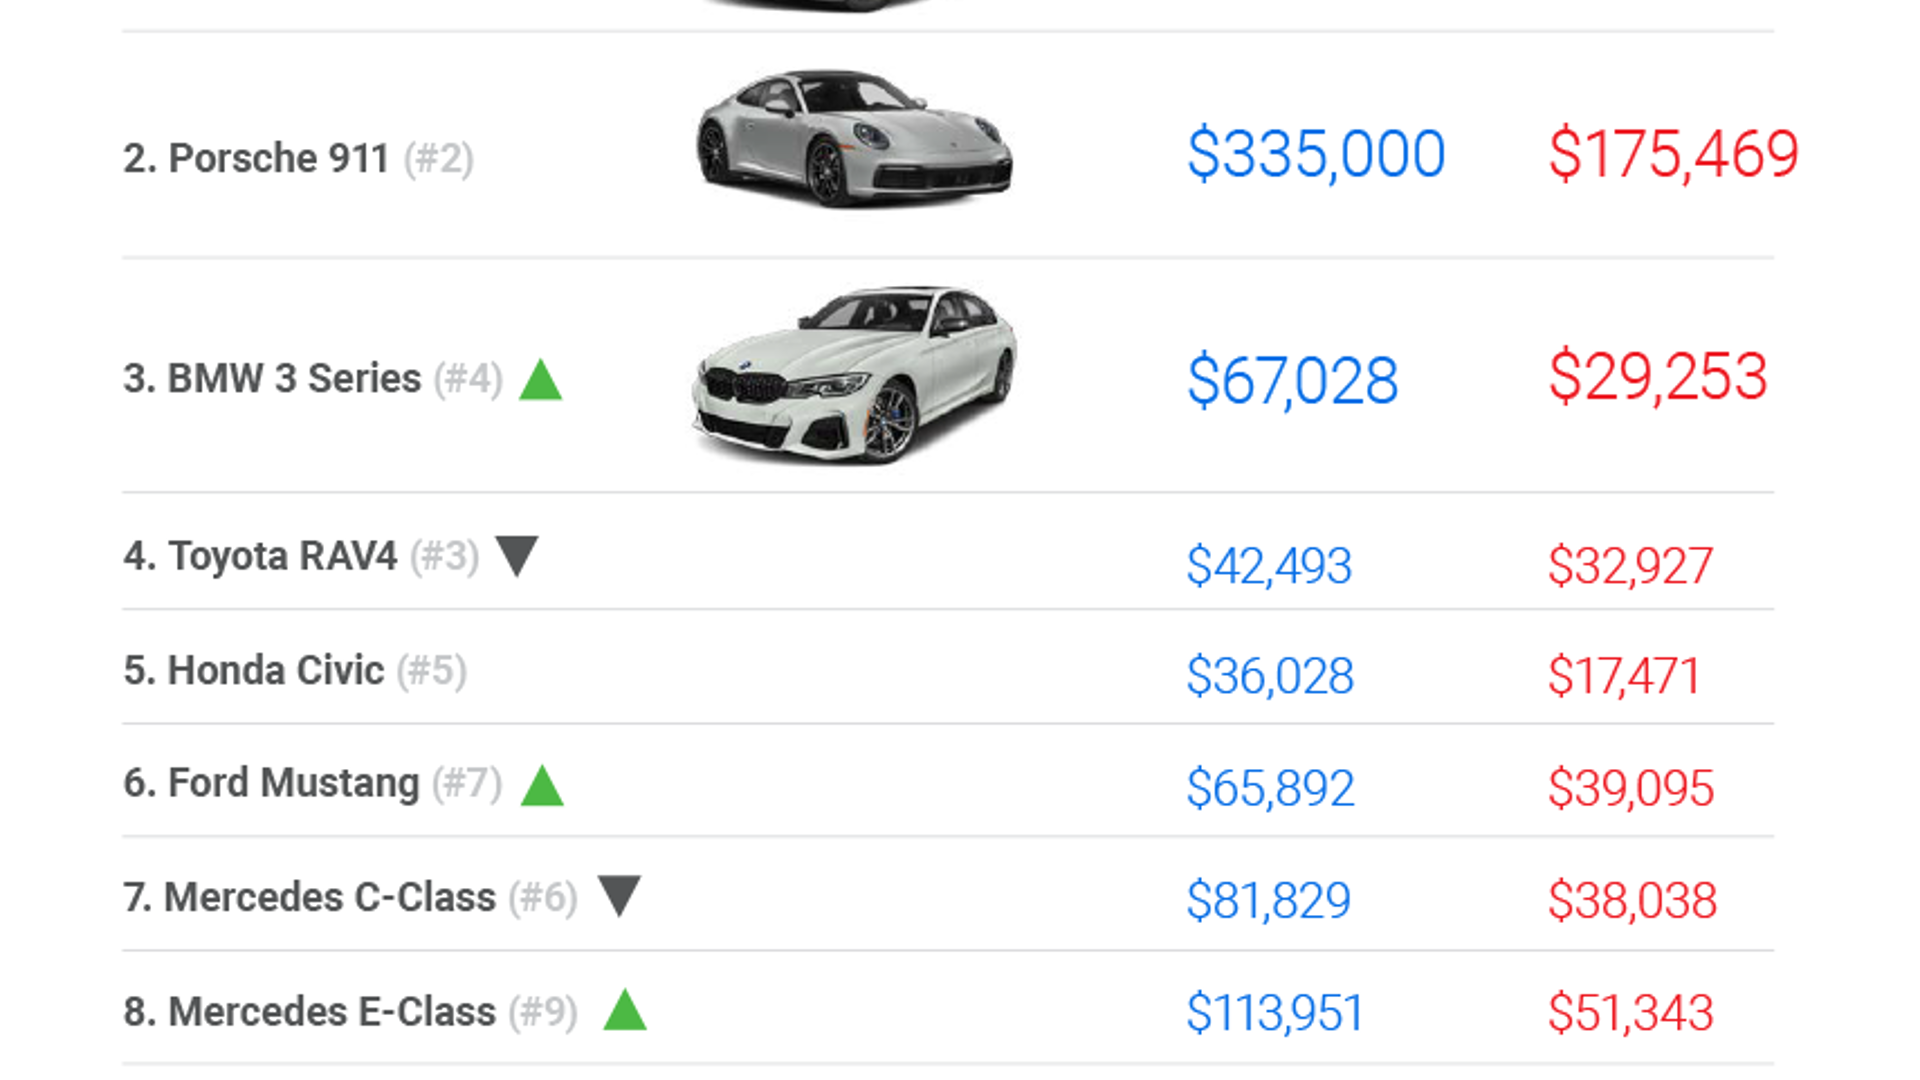
Top Searched Vehicles: National
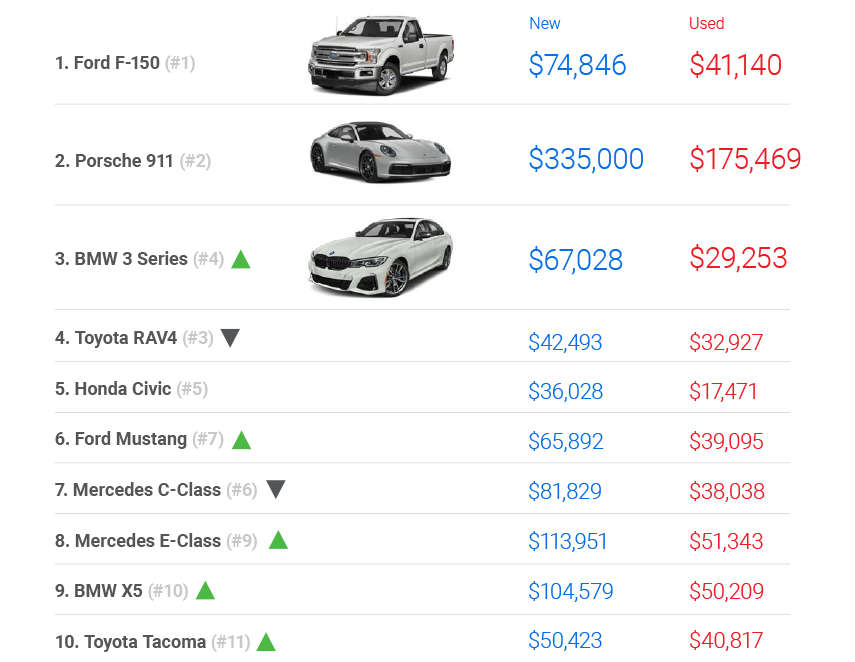
| Vehicle (by Rank) | Previous Rank | Movement | New Price | Used Price |
|---|---|---|---|---|
| 1. Ford F-150 | #1 | = | $74,846 | $41,140 |
| 2. Porsche 911 | #2 | = | $335,000 | $175,469 |
| 3. BMW 3 Series | #4 | ↑ | $67,028 | $29,253 |
| 4. Toyota RAV4 | #3 | ↓ | $42,493 | $32,927 |
| 5. Honda Civic | #5 | = | $36,028 | $17,471 |
| 6. Ford Mustang | #7 | ↑ | $65,892 | $39,095 |
| 7. Mercedes C-Class | #6 | ↓ | $81,829 | $38,038 |
| 8. Mercedes E-Class | #9 | ↑ | $113,951 | $51,343 |
| 9. BMW X5 | #10 | ↑ | $104,579 | $50,209 |
| 10. Toyota Tacoma | #11 | ↑ | $50,423 | $40,817 |
Methodology
Based on the top ten most commonly searched vehicles for new and used listings, on AutoTrader in December 2023. Prices indicated refer to the average new and average used price for each vehicle, averaged across all trim levels. Rankings for the month of May appear in brackets for reference. The average has been adjusted based on the make and age of the vehicles available on the market during the collection period. The adjustments mean that any fluctuations in inventory won’t pull the average too far in one direction or another.
Vehicle Inventory (New): By Quarter
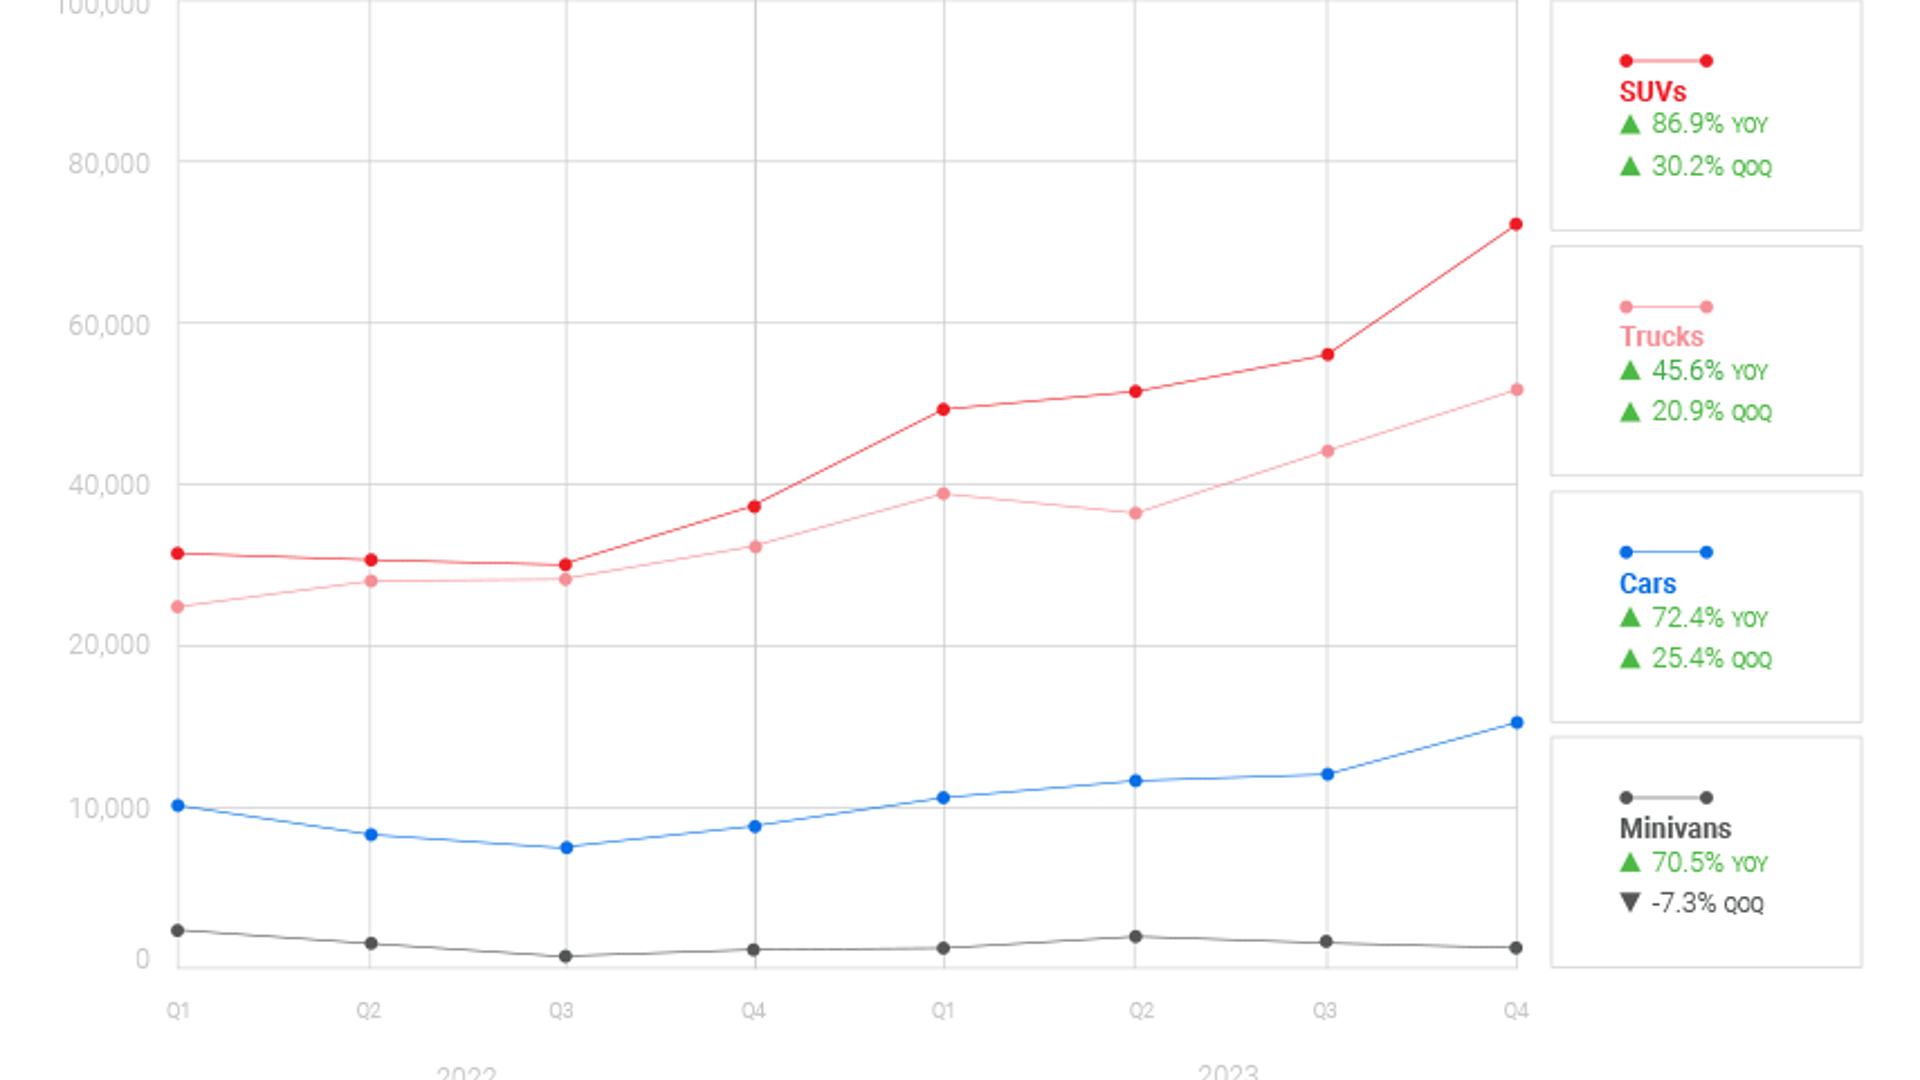
| Segment | YOY Change | QOQ Change |
|---|---|---|
| Cars | 72.4% | 25.4% |
| SUVs | 86.9% | 30.2% |
| Trucks | 45.6% | 20.9% |
| Minivans | 70.5% | -7.3% |
New inventory levels have increased for all body types
All types of new vehicle inventory, except minivans (a small percentage of total available inventory), showed double-digit increases in Q4. With the lift to new car inventory levels, we’ve observed slight declines in new vehicle prices.
Methodology
This data is the average of the total number of used automotive listings for the quarter on AutoTrader segmented by vehicle type (car, SUV, truck, minivan). Based on total listings, the data will be analyzed on a year-over-year and quarter-over-quarter basis to identify overall inventory availability in the market. Given that AutoTrader is the largest automotive marketplace in Canada, the data represents a snapshot of the overall Canadian automotive market.
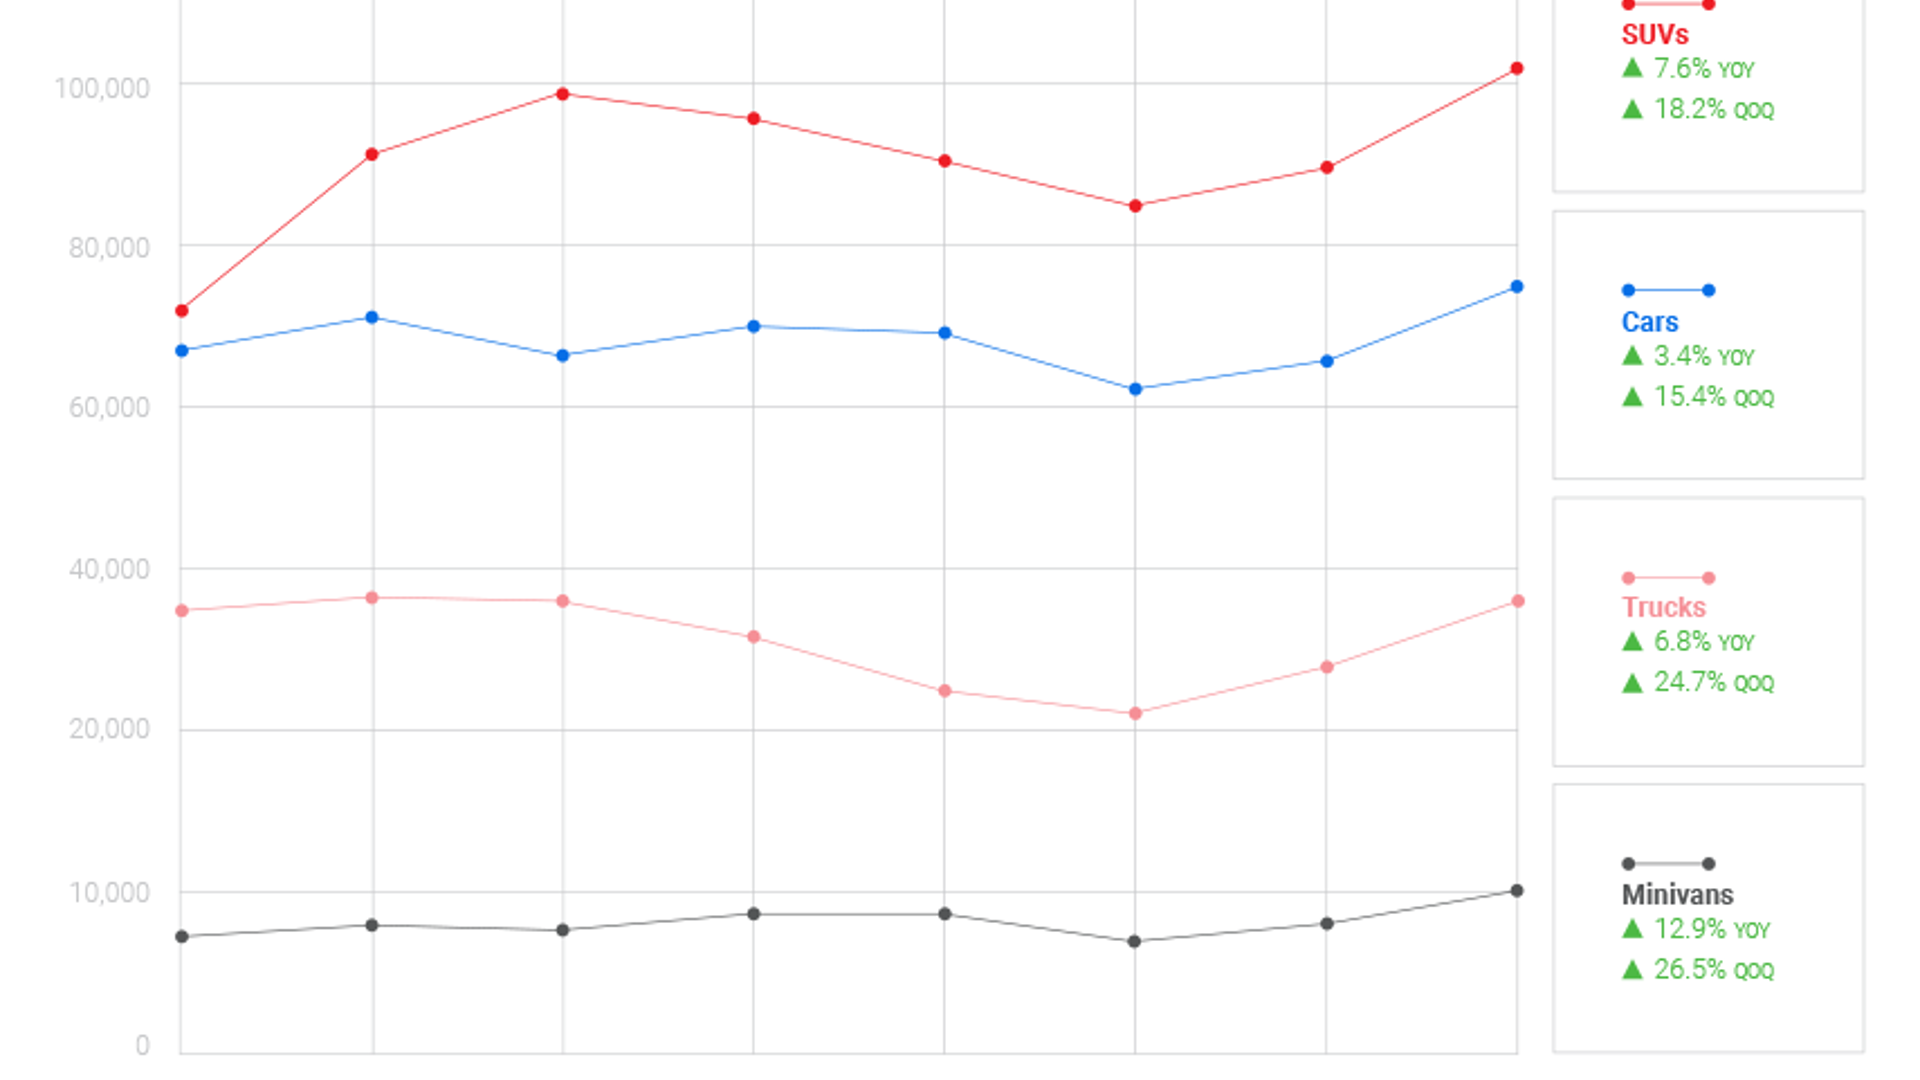
Vehicle Inventory (Used): By Quarter
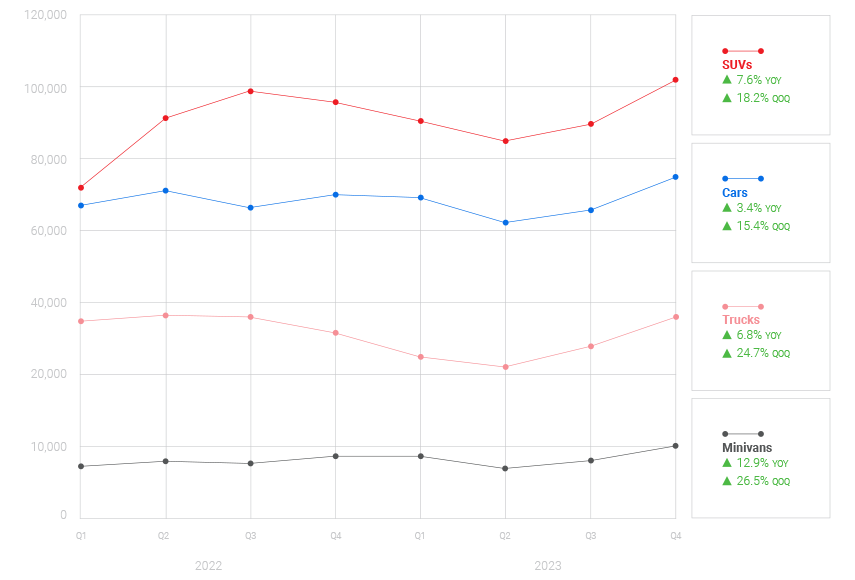
| Segment | YOY Change | QOQ Change |
|---|---|---|
| Cars | 3.4% | 15.4% |
| SUVs | 7.6% | 18.2% |
| Trucks | 6.8% | 24.7% |
| Minivans | 12.9% | 26.5% |
Used inventory availability is increasing and currently just above last year’s level
Used vehicle inventory is approaching 2019 levels. This increase is attributed to the rise in new car availability and resulting sales, spurred by a lift to trade-ins at dealerships, along with a slight dip in used car demand.
Methodology
This data is the average of the total number of used automotive listings for the quarter on AutoTrader segmented by vehicle type (car, SUV, truck, minivan). Based on total listings, the data will be analyzed on a year-over-year and quarter-over-quarter basis to identify overall inventory availability in the market. Given that AutoTrader is the largest automotive marketplace in Canada, the data represents a snapshot of the overall Canadian automotive market.
Want to know more about trends in automotive pricing? See the full report and past editions of the AutoTrader Price Index.